

Downloads
Framework Diagrams
17 high-resolution figures from the book. Download and use in presentations, reports, and discussions with attribution.
Free — enter your email
Unlock all 17 framework diagrams.
One email unlocks every high-resolution diagram on this page — free for readers.
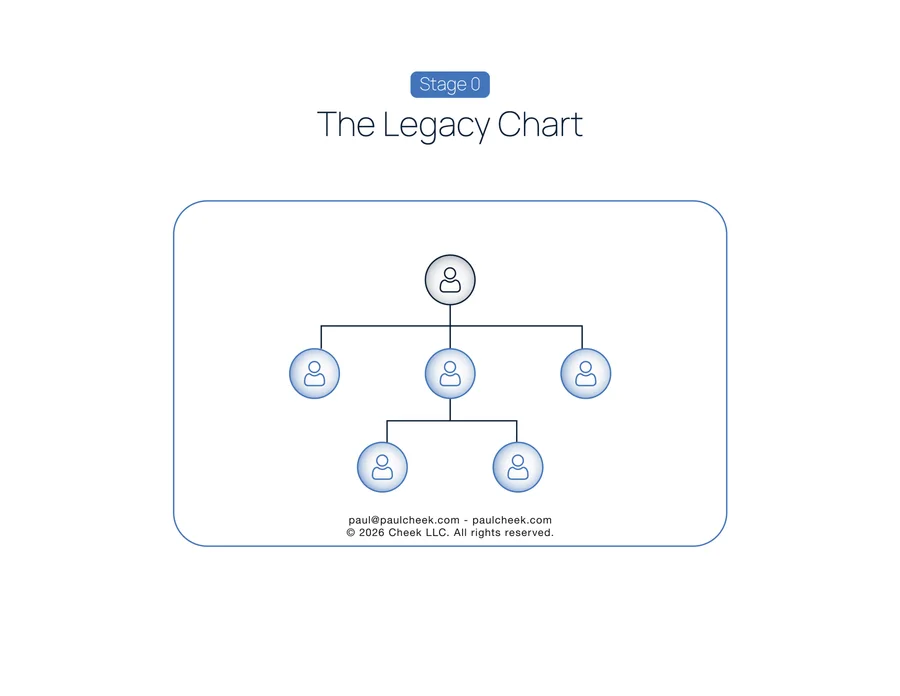
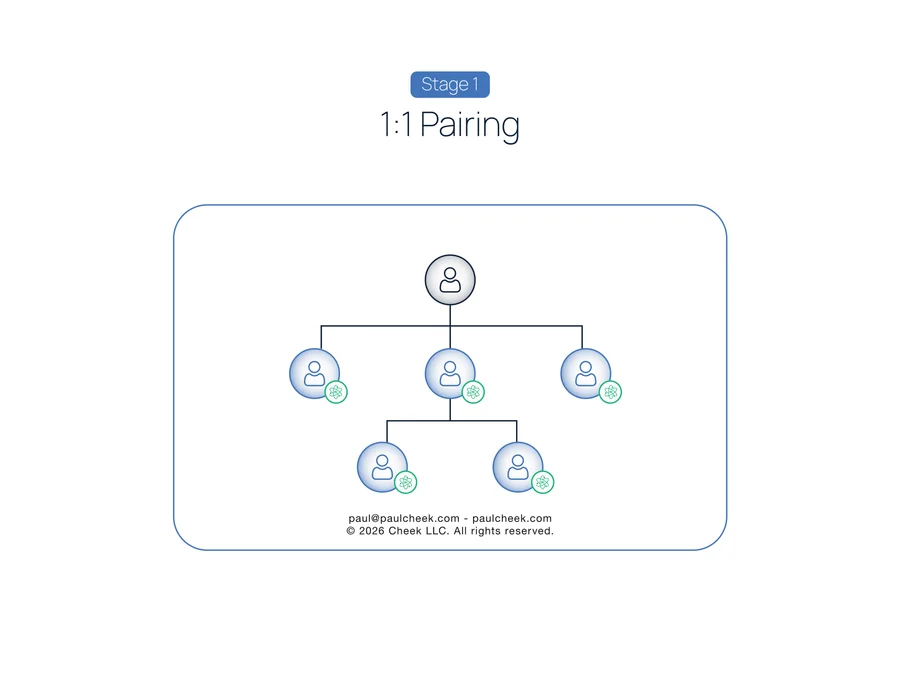
Ch. 09 · Figure 9.1, stage 2 of 6
State of the Art Org Chart — Stage 1: One-to-One Pairing
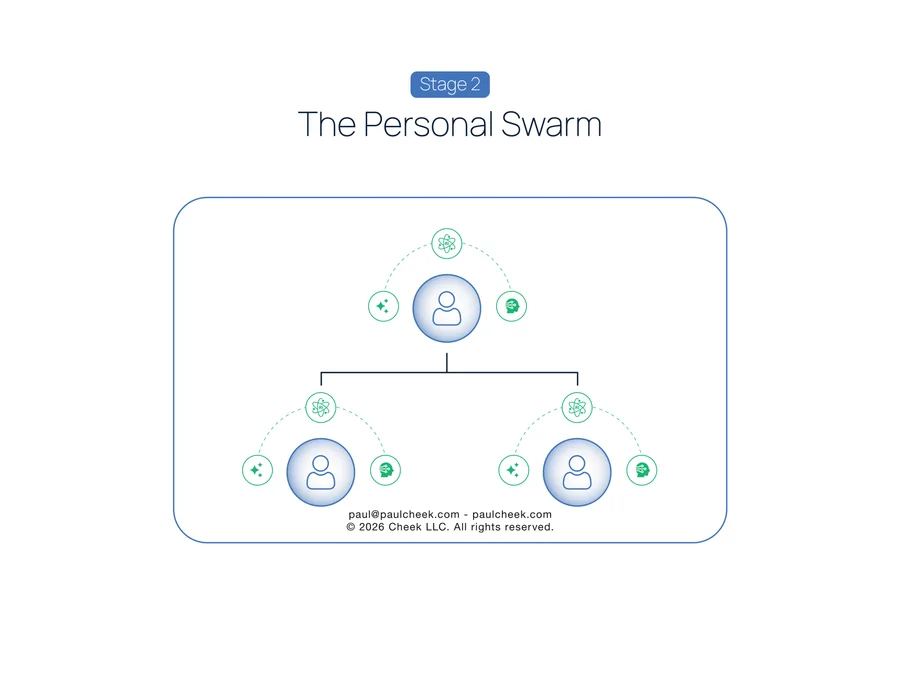
Ch. 09 · Figure 9.1, stage 3 of 6
State of the Art Org Chart — Stage 2: Personal Swarm
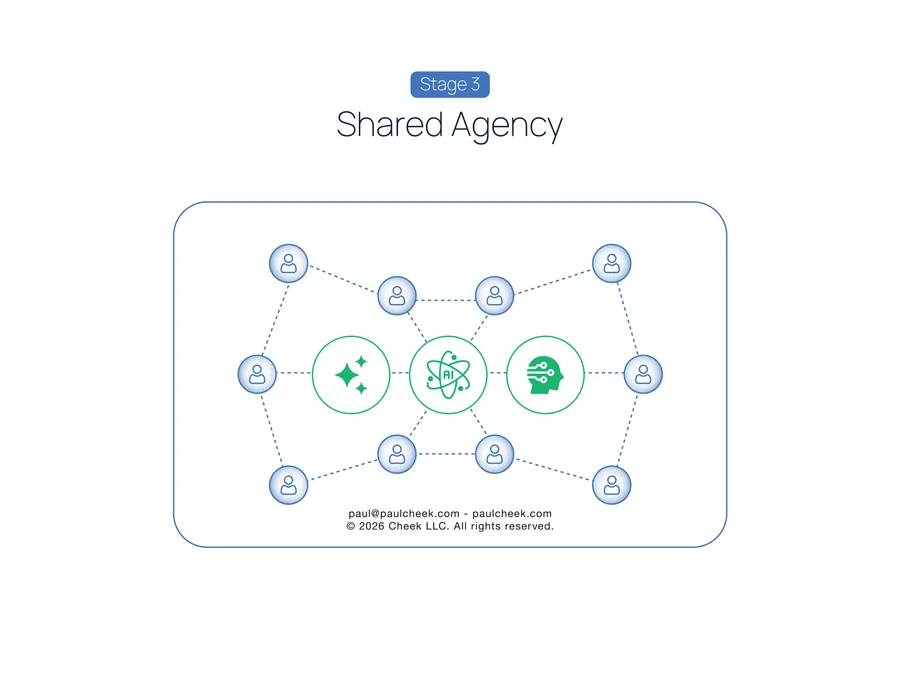
Ch. 09 · Figure 9.1, stage 4 of 6
State of the Art Org Chart — Stage 3: Shared Agency
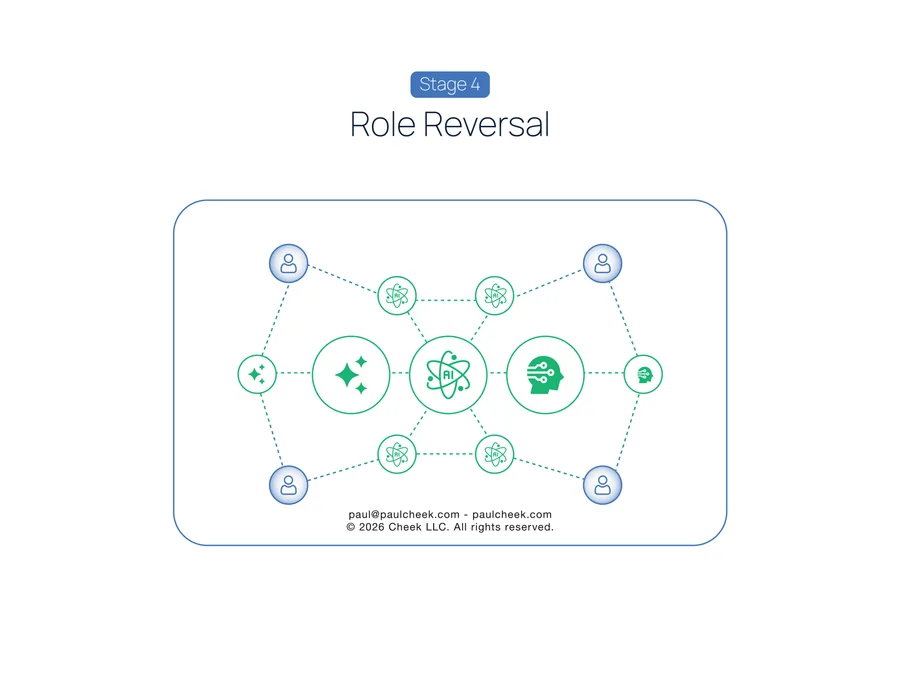
Ch. 09 · Figure 9.1, stage 5 of 6
State of the Art Org Chart — Stage 4: Role Reversal
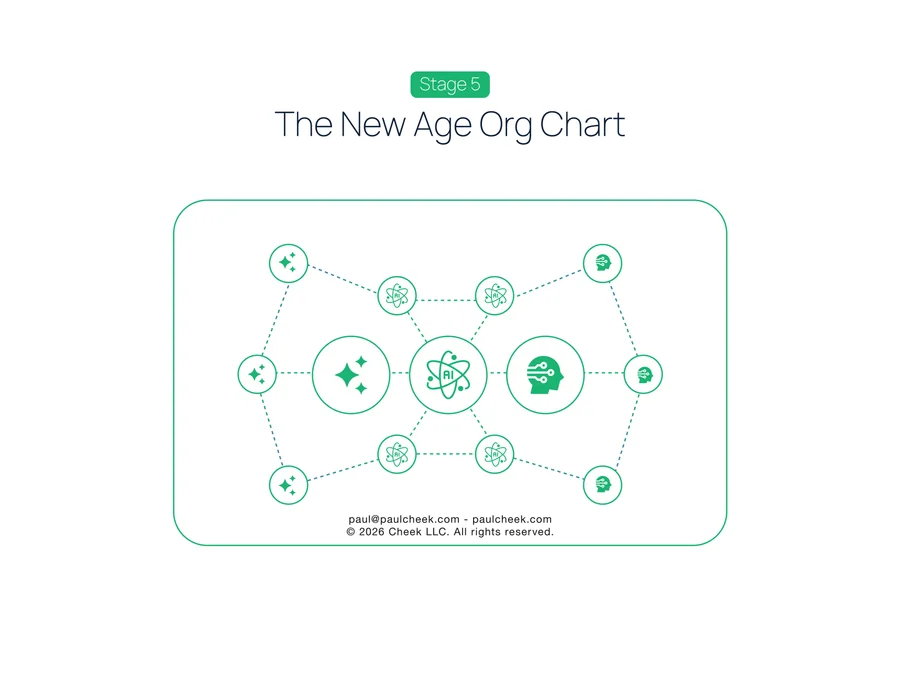
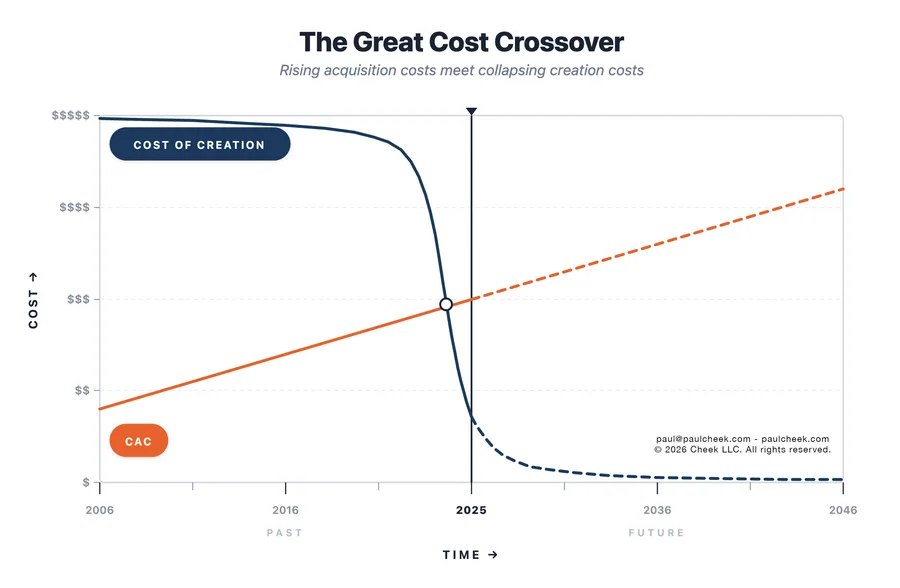
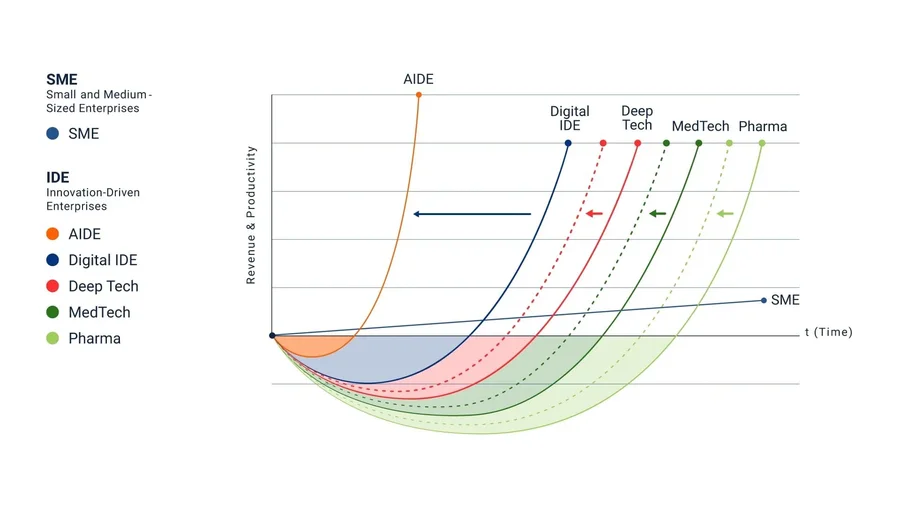
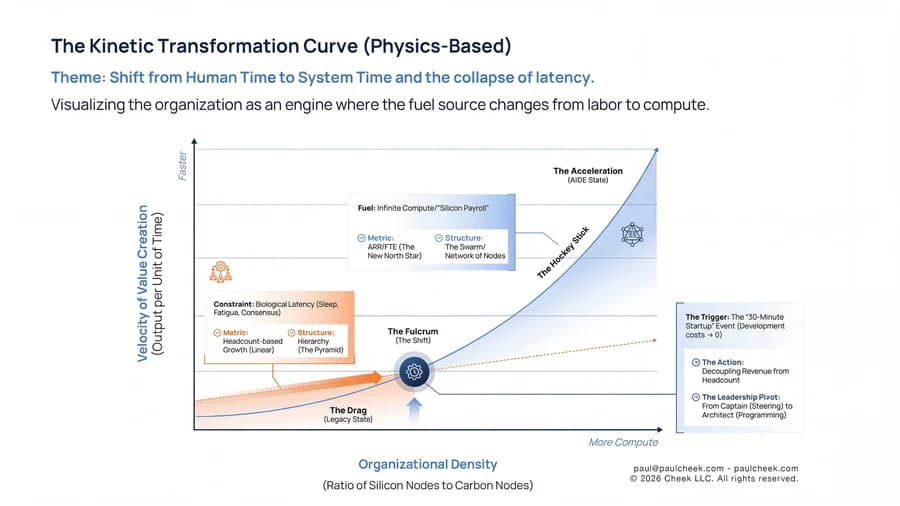
Part IV — The Actions
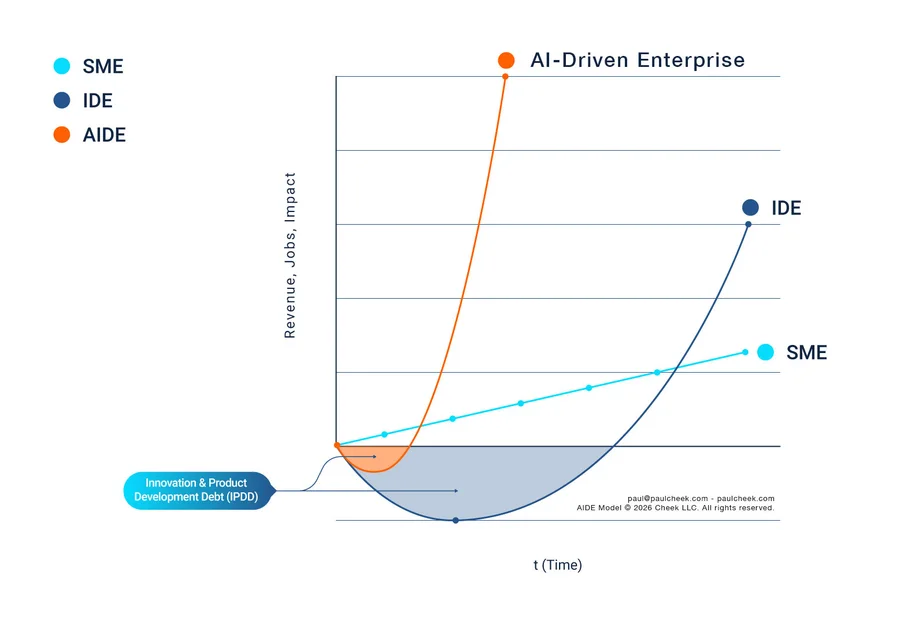
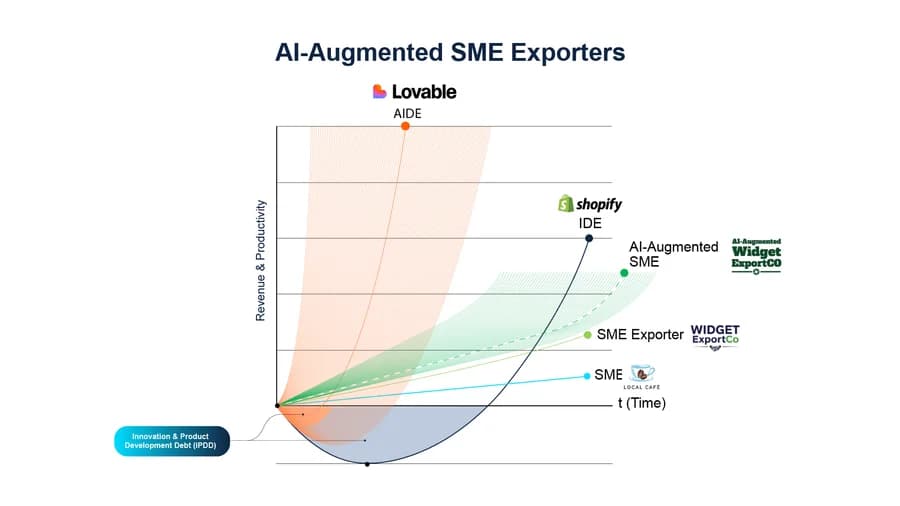
Kinetic Transformation Curve

About Paul Cheek
Paul Cheek is a global expert on AI-driven enterprises and enterprise innovation. He is a Senior Lecturer at the MIT Sloan School of Management and Senior Advisor for Entrepreneurship & Artificial Intelligence at the Martin Trust Center for MIT Entrepreneurship. As founder of the AI-Driven Enterprise Institute and Entonomy, he develops data systems and software that power AI agent-run businesses. A Forbes 30 Under 30 honoree, bestselling author of Disciplined Entrepreneurship: Startup Tactics, and recipient of MIT’s Monosson Prize for impact on entrepreneurship education, Paul has advised and built ventures from seed to scale, with his work featured in Bloomberg, CNBC, Forbes, CNN, Inc., Entrepreneur, and more.
Read Paul’s full bio →The weekly newsletter
Stay close to the work.
What Paul is seeing in AIDE strategy, board-level AI, and PE/VC moves. Short. Tactical.